Understand the goal
Define what you want to know, where the data lives, and how you use it today.

Data Management & Insights
We bring your business data together and turn it into clear, useful insights.
Home / Client Support / Data Management & Insights
Websites & Digital Presence
A website that works for your business
A well-planned website helps customers find your business, understand what you offer, and decide what to do next. PraTech Digital helps small and medium-sized businesses plan and build websites that fit their goals, audience, industry, and budget.
Apps & Workflow Automation
Make everyday work easier
The right app turns hours of repetitive work into a few clicks, so your team can spend its time on customers and growth instead of admin.

A practical approach
We help small and medium-sized businesses clean and connect their data, structure it in a spreadsheet or SQL or NoSQL database, and make it useful through reports, dashboards, and analysis.
Your information may be spread across spreadsheets, business tools, or existing databases. We can help organize it, create a practical workflow to move and prepare it, and use it to answer real business questions.
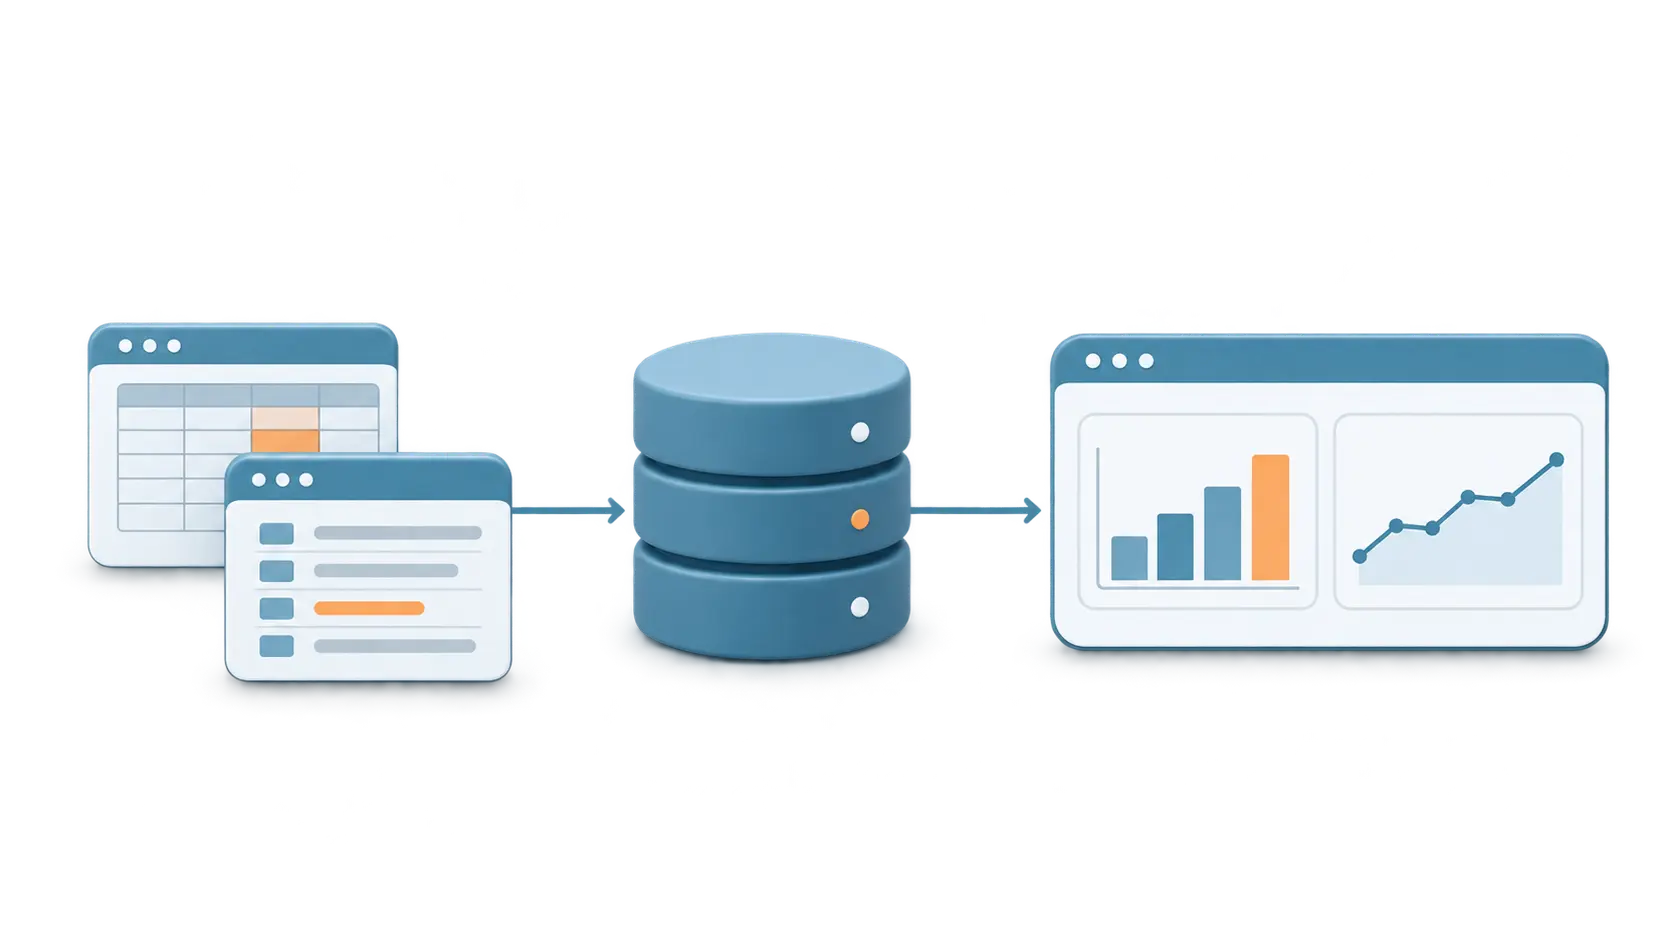
Collect
Sales, enquiries, purchases, payments, and completed jobs all create data. We can help you decide which information is useful to track and set up a consistent way to collect it. With clean, reliable records, you can see what is working and where to focus.
Prepare
The right information depends on your business and the decisions you want to make. We can help organize data from spreadsheets, business tools, and databases into reports and dashboards that make those answers easier to find.
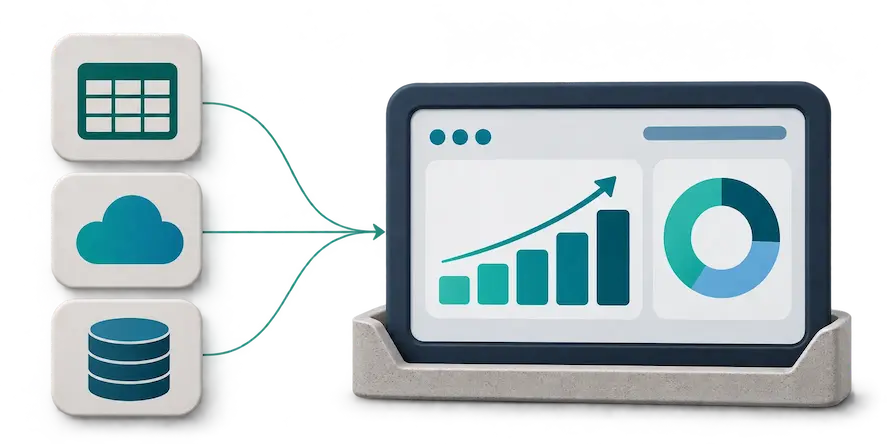
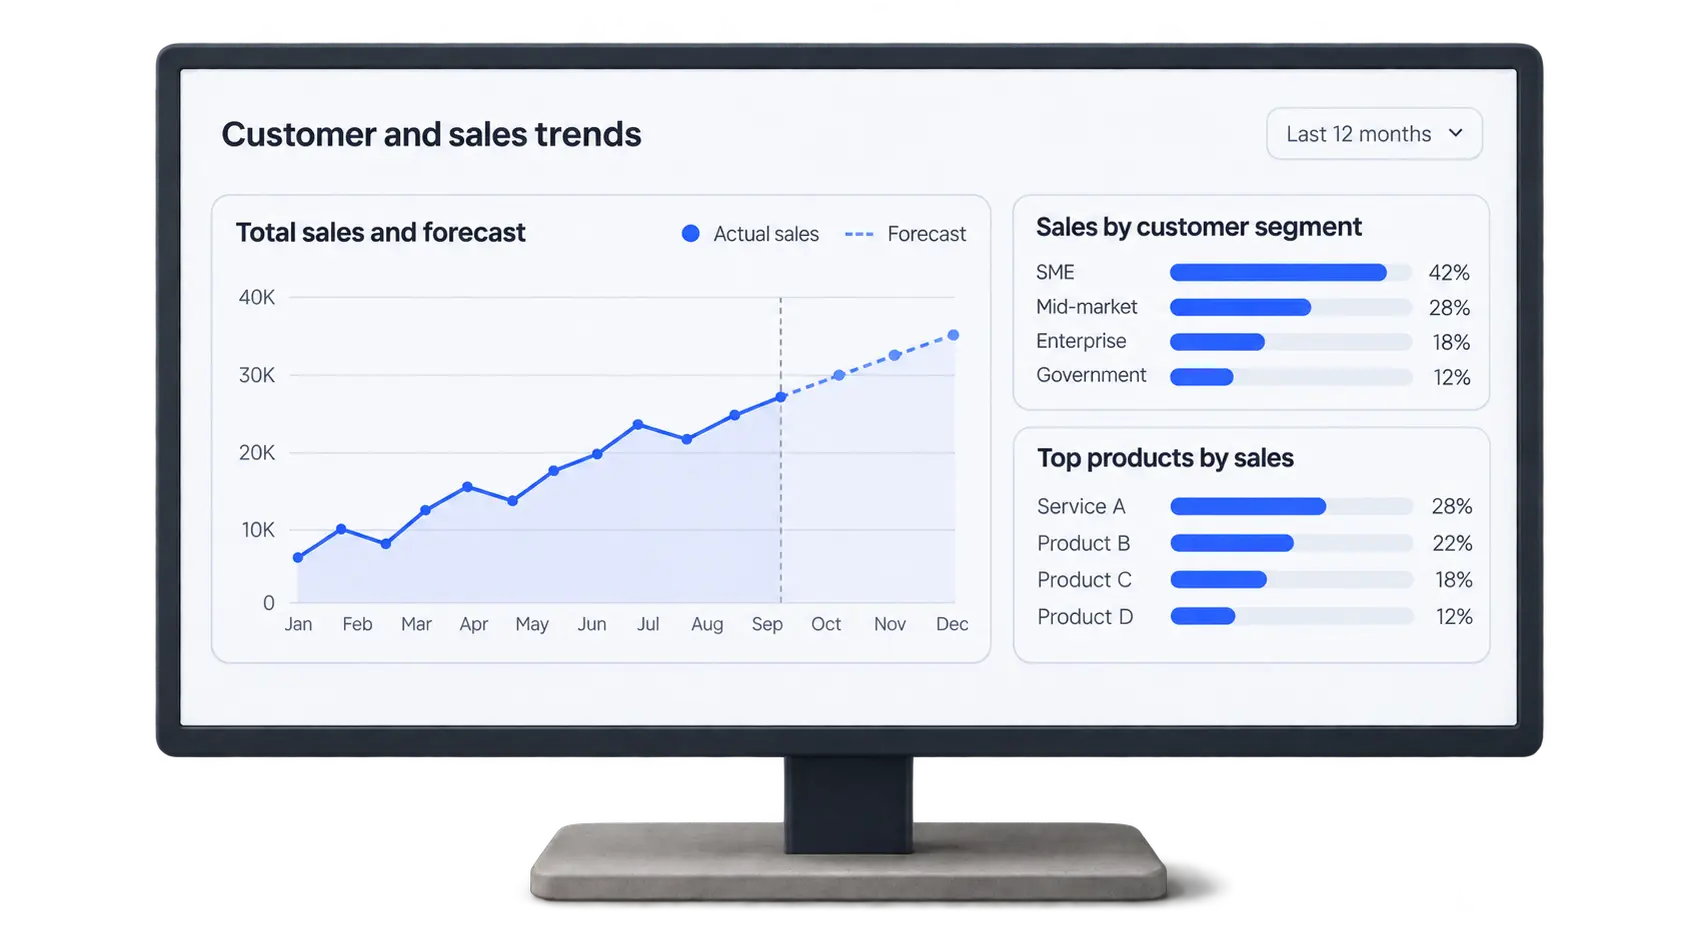
Analyze
We can analyze trends over time, compare products or customer groups, and investigate what may be driving results. When useful, statistical methods or machine learning can help identify patterns and create forecasts.
Visualize and hand over
We can connect your prepared data to dashboards that refresh on a regular schedule. Your team can check key metrics in one place, without manually rebuilding reports each time.
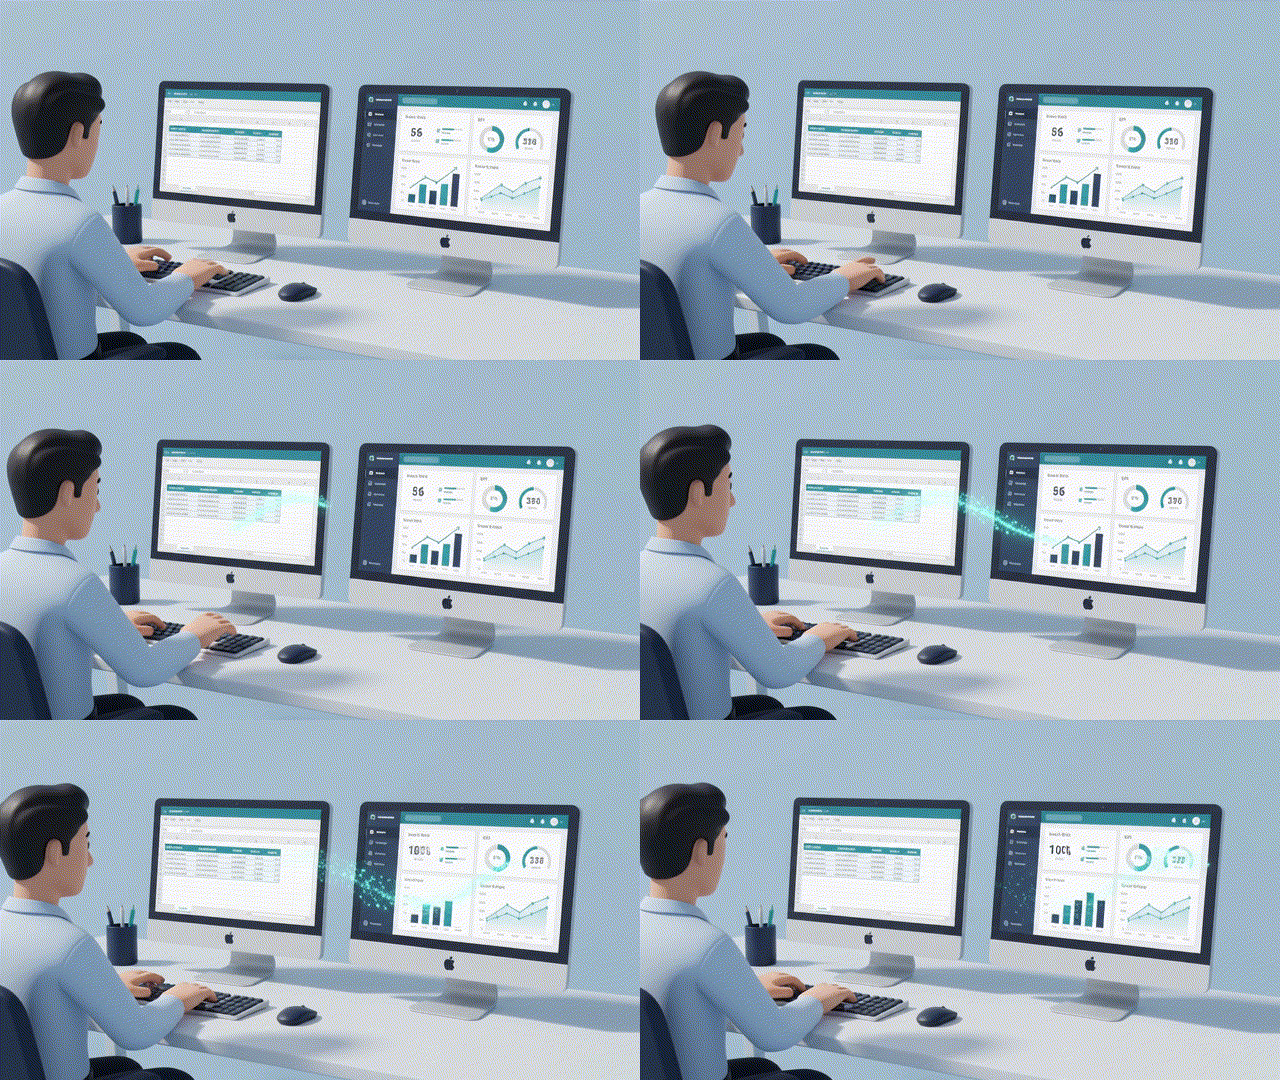
Data & Insights
See what information a business can collect, which questions it can answer, and how the results can appear in a dashboard.
Key information a business can collect about sales and orders.
Date, product or service, quantity, price, discount, and sales channel.
Here are some of the questions a business can explore.
See how this data can appear in a dashboard to answer those questions.
Key information a business can collect about customer enquiries.
Enquiry date, service requested, referral or marketing source, response time, and outcome.
Here are some of the questions a business can explore.
See how this data can appear in a dashboard to answer those questions.
Key information a business can collect about inventory and purchasing.
Items purchased and sold, stock levels, supplier, purchase date, and delivery time.
Here are some of the questions a business can explore.
See how this data can appear in a dashboard to answer those questions.
Key information a business can collect about costs and payments.
Expenses, invoices, payment dates, amounts due, and amounts received.
Here are some of the questions a business can explore.
See how this data can appear in a dashboard to answer those questions.
Key information a business can collect about jobs and service delivery.
Job type, dates, status, hours, completion time, and customer feedback.
Here are some of the questions a business can explore.
See how this data can appear in a dashboard to answer those questions.
Key information a business can collect about team workload and performance.
Tasks assigned and completed, time spent, turnaround time, quality checks, rework, and relevant customer feedback.
Here are some of the questions a business can explore.
See how this data can appear in a dashboard to answer those questions.
01 / 06
Our approach
PraTech begins by understanding your business question, then helps collect, prepare, and analyze the right data. We turn the findings into clear reports, dashboards, or practical workflows your team can use.
Define what you want to know, where the data lives, and how you use it today.
Check for duplicates, missing values, inconsistent formats, and files to combine.
Choose a spreadsheet, SQL database, or NoSQL database to suit the project.
Create an ETL workflow to extract, transform, and load data where systems allow.
Turn business questions into analysis, reports, and dashboards.
Explain how the data structure and reports work, and discuss ongoing support.
Built around your project: The right tools and level of automation depend on your data, systems, and access.
Put your data to work